Summary statistics of average monthly temperatures in New Braunfels, Texas, collected since the end of the nineteenth century till about 1994. The reader is also welcommed to inspect the warming trends in the location. To convert the results in degrees of Fahrenheit, click here.
| Jan | Feb | Mar | Apr | May | Jun | Jul | Aug | Sep | Oct | Nov | Dec | |
|---|---|---|---|---|---|---|---|---|---|---|---|---|
| Minimum | 5.15 | 5.71 | 10.31 | 16.74 | 19.98 | 25.19 | 26.70 | 25.94 | 22.88 | 16.79 | 9.68 | 5.93 |
| Lower Bound | 9.72 | 11.73 | 15.40 | 19.52 | 23.07 | 27.38 | 28.71 | 28.54 | 25.95 | 21.03 | 15.19 | 10.84 |
| Average | 10.15 | 12.13 | 15.78 | 19.77 | 23.31 | 27.57 | 28.89 | 28.74 | 26.18 | 21.29 | 15.53 | 11.21 |
| Upper Bound | 10.59 | 12.54 | 16.17 | 20.02 | 23.54 | 27.76 | 29.06 | 28.93 | 26.40 | 21.55 | 15.87 | 11.58 |
| Maximum | 15.63 | 17.02 | 20.87 | 23.75 | 26.07 | 30.38 | 31.41 | 31.64 | 28.93 | 25.61 | 20.22 | 17.36 |
| Sample Size | 107 | 115 | 108 | 116 | 116 | 120 | 110 | 120 | 109 | 117 | 115 | 115 |
 Data Description
- Observation period: 1874/1 - 1994/12.
- Total number of records: 1452.
- Number of missing data: 84.
- Percentage of missing data: 5.79.
- Minimum monthly temperature: 5.15 °C.
- Maximum monthly temperature: 31.64 °C.
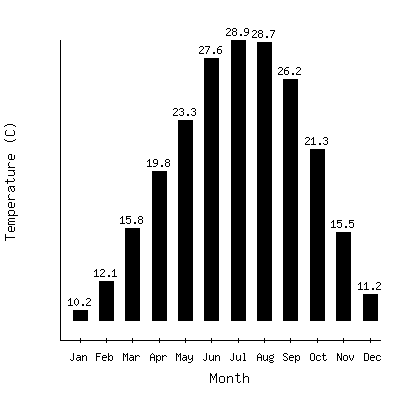
Plot of the average monthly temperatures in New Braunfels, Texas.
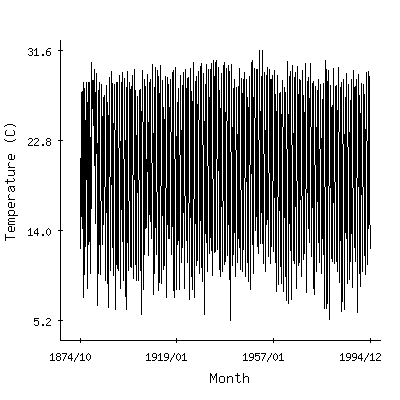
Plot of the 'raw' monthly average temperatures in New Braunfels, Texas.